 English
 Russian
Solana (SOL) order book heatmap
A live density map of the solana order book: large limit orders only. The candles show the price path, the labels on the right are the «walls». The biggest support wall right now is 23,451 SOL at $116 (-3.67% from the current price).
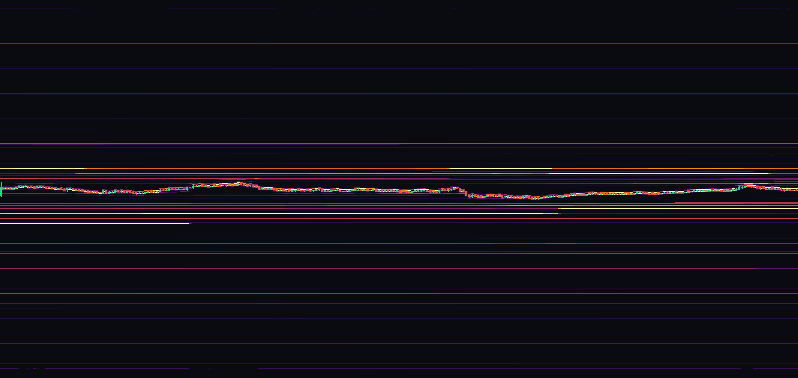
Largest orders in the SOL order book
| Level | Price | Size | From price | History |
|---|---|---|---|---|
| Resistance | 125 | 14,846 SOL | +3.81% | not tested |
| Resistance | 124 | 16,922 SOL | +2.98% | not tested |
| Resistance | 121 | 17,750 SOL | +0.32% | 11 touches · broken |
| — price now 120 — | ||||
| Support | 120 | 15,569 SOL | -0.01% | 9 touches · broken |
| Support | 116 | 23,451 SOL | -3.67% | not tested |
| Support | 115 | 13,537 SOL | -4.50% | not tested |
Data as of 05.10.2026 12:35 UTC · map built from 107 days of order-book history · RSI(14) 1h: 44 — neutral zone
How to read the map
A dense yellow trail is a «wall» — a large limit order that holds over time. A wall below price is support, above it resistance. This is the spot order book of several exchanges, not modelled futures liquidations — real money queued right now.
Where leveraged positions pile up.
Every coin, your choice of exchanges, Telegram alerts. Free.
How to use the order-book heatmap
The heatmap shows the exchange order book — the queue of limit orders that participants placed in advance. Time runs along the horizontal axis, price along the vertical one, and a cell's brightness is the order volume resting at that level. The brighter the band, the more money is queued at that price.
What a wall is. A dense bright line stretching horizontally is a large order that persists over time. A wall below the current price acts as support: to break through it, the market has to buy out that entire volume. A wall above is resistance. A brief flash that appears and disappears within a minute is not a wall — that order was most likely pulled without ever being filled.
Why spot rather than futures. We build the map from spot books across several exchanges. Futures carry more volume, but that is leveraged money which evaporates at the first sharp move. On spot, an order means readiness to actually buy the coin with actual money, so spot levels last longer and turn out to be real more often.
How to use it. Look at the balance of density above and below price. If several large levels sit under the price and there is emptiness above, a move up costs the market less than a move down. The reverse picture means seller pressure. A level price has approached several times without breaking matters more than one nobody has tested yet — the “History” column in the table above shows this.
What the map cannot do, and where it lies. An order can be placed and pulled without ever being filled — this is called spoofing, and it is routine on crypto exchanges. So a “wall” is under no obligation to hold price; it is only obliged to show an intention that was declared. The second limitation: exchanges do not provide order book history, and it cannot be downloaded after the fact. Our data accumulates forward only, from the moment we started recording this coin — if a service promises you “the order book for 2019”, it is showing a reconstruction, not a recording.
How this differs from candle volume. A candle shows what has already been executed: that volume cannot be faked and pulled, but it is always in the past. The order book shows intent — finer and leading, but open to manipulation. The strongest conclusions come where both sources agree: price approaches a dense level and traded volume there rises.
The fully interactive version, with a choice of exchange, history depth and a minimum order size, is in the terminal. How this data is collected and normalised is described on the methodology page.
Frequently asked questions
What is a Solana order book heatmap?
It is the SOL/USDT spot order book drawn over time. Every limit order on Binance, Coinbase, Bitstamp and MEXC becomes a coloured cell at its price; the brighter the cell, the more money is waiting there. You see not only where the walls are now but how long they have stood.
How do I read the order book heatmap?
Bright horizontal lines are large limit orders, often called walls. A line that holds for hours or days is real interest to buy or sell at that level. A line that vanishes just before price arrives was most likely pulled or placed to mislead, which is known as spoofing.
Why do you use the spot order book and not futures?
Spot orders are backed by real coins and dollars, without leverage, so large spot walls are harder to fake and say more about real supply and demand. Futures positioning is covered by the liquidation map, funding and open interest pages.
What is the difference between a liquidity heatmap and a liquidation heatmap?
A liquidity heatmap shows orders already resting in the book. A liquidation heatmap shows where leveraged positions would be force-closed. We have both for SOL, and they work best side by side.
How much history does the heatmap keep?
We collect the order book ourselves around the clock, so the history covers months, not only the last session. You can zoom out to see which levels held on previous tests.
Is it free?
Yes. The SOL order book heatmap is free and works without sign-up. The full terminal adds more coins, timeframes and indicators.